 penguinTrace
Introduction
penguinTrace allows you to see the instructions that code compiles down to and see how they get executed in order to run a program.
penguinTrace starts a web-server, and then code can be entered into the web interface. After compiling the code (▶), the interface will show the source code on the left and the assembly on the right. The current line of code will be highlighted on both sides.
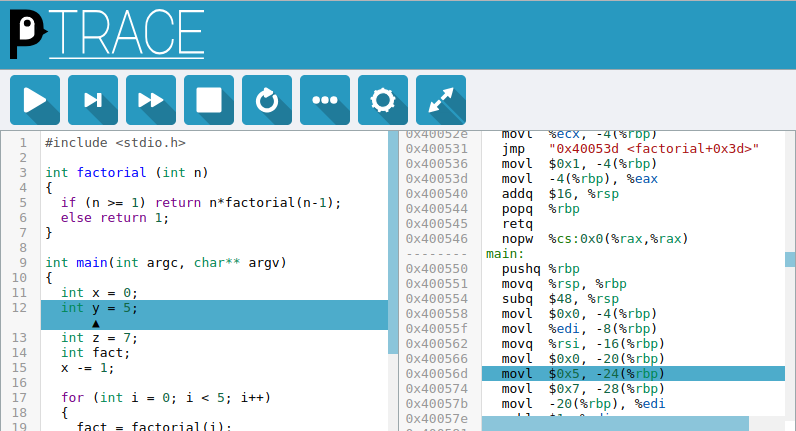
The code can then be stepped through by instruction (▶) or line (▶|), and the ‘More Details’ (⋯) window shows the contents of the registers, variables in the current scope and the current stack.
Getting Started
Note: penguinTrace allows running arbitrary code by design. By default it will only listen on the loopback device to reduce the potential risk.
This section contains quick instructions to run penguinTrace, full details can
be found in README.md in the repository.
The quickest way of running penguinTrace is through Docker. The image can be built with the following command:
docker build -t penguintrace github.com/penguintrace/penguintrace
This will produce a container called penguintrace which can then be run as
follows:
docker run -it -p 127.0.0.1:8080:8080 --tmpfs /tmp:exec --cap-add=SYS_PTRACE --cap-add=SYS_ADMIN --rm --security-opt apparmor=unconfined penguintrace penguintrace
This runs penguinTrace on the loopback device (localhost) with AppArmor
disabled, the README contains details of how to better secure penguinTrace.
Particular care should be taken if allowing penguinTrace to bind to addresses
other than loopback.